Tactical Analysis
- Maroon Report

- Sep 29, 2023
- 2 min read
Having a little look at some data this season to combine with a tactical analysis I'm working on. Some things were an eyebrow raiser...
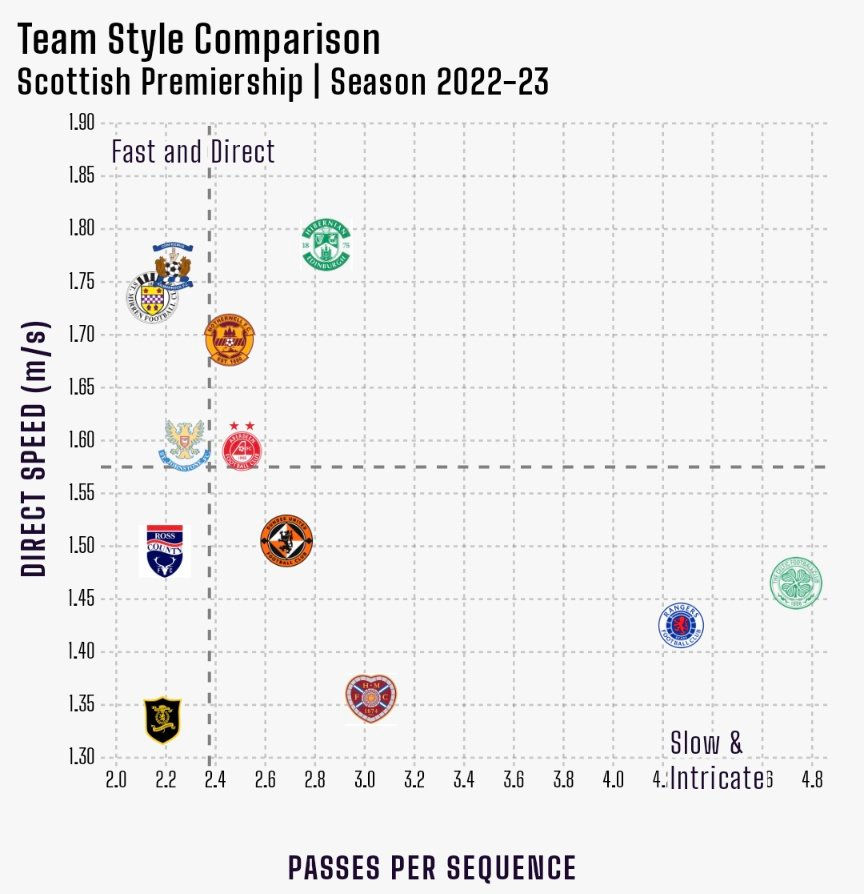
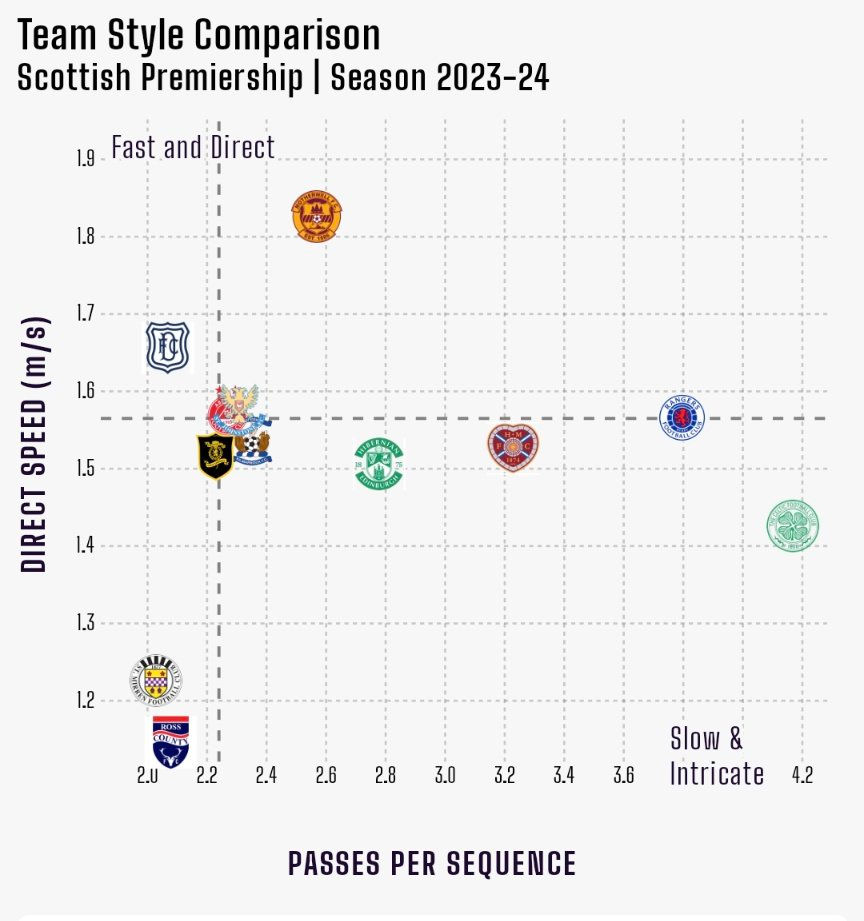
Team style of play comparison from 22/23 & 23/24. As illustrated below, our playing style and how our passes per sequence haven't fluctuated our speed & directness has fairly significantly.
Zones labelled TEAM (Blue) gain more than 55% of total touches. Zones labelled OPPOSITION (Red) show where the opposing team gain more than 55% of total touches, while the others are considered CONTESTED (Grey)

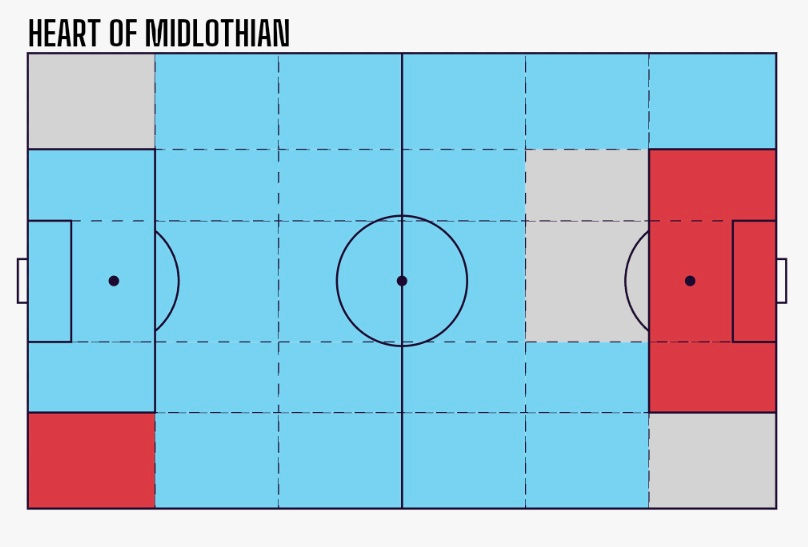
The images above, (top 22/23 & 23/24/bottom) on the pitch are teams touching the ball more than their opponents in open play. You can see we are controlling the ball in vast more areas on in areas of the pitch especially a lot further upfield than previously.
Our zones are ranked HIGH (Purple) for the number of team touches and LOW for the number of opposition touches are not to different and its understandable with Cochrane particularly when in the team playing that inverted role and the half space indicates this.


Last season the half-space was occupied by a different perspective with McKay controlling this space. However, not as effective as the previous season.
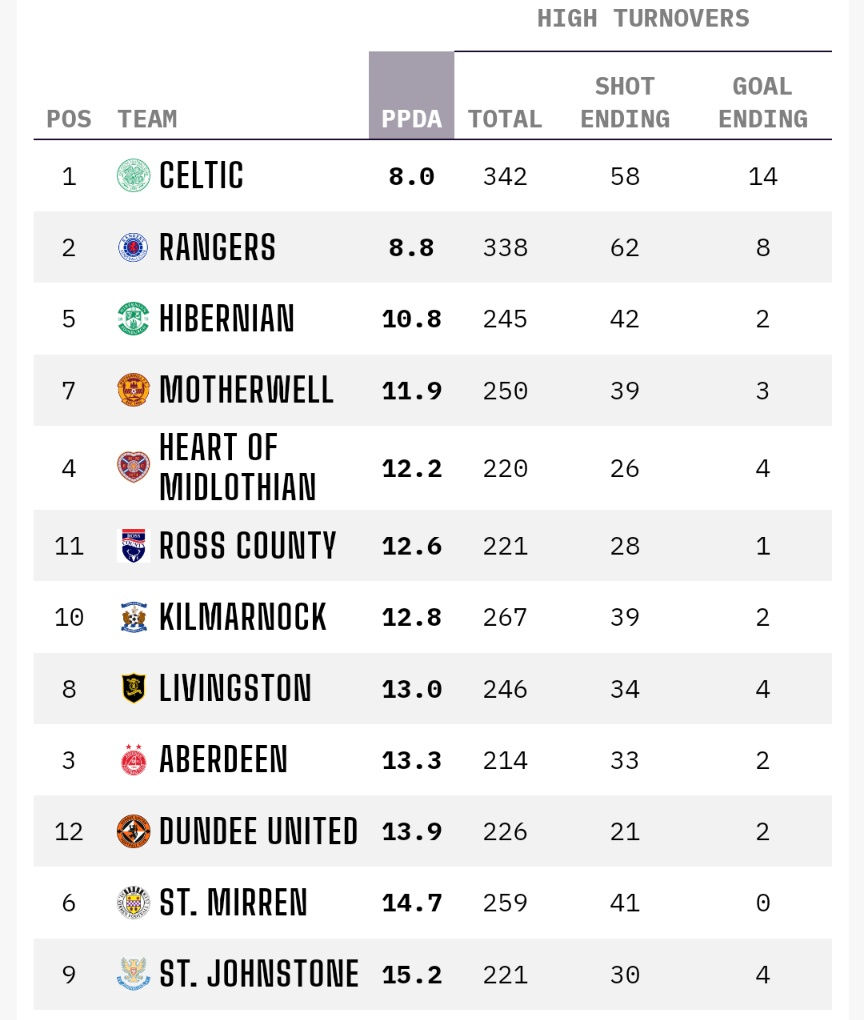
The big surprise I came across was our defensive pressing while studying the data. Our team sequence pressures is ranked 1st in the league!

PPDA is the number of opposition passes allowed outside of the pressing team's own defensive third. A lower figure indicates a higher level of pressing, while a higher figure indicates a lower level of pressing!
For comparison last season as seen below our PPDA was ranked 5th with 12.2 to 1st at the present at 8.5.
Although this season's comparison to last seasons is a smaller data set to look at. From my own POV, it's interesting to look at as it's fascinating to look at Eye v Data while analysing objectively.


Comments